WORST PERFORMANCES: 7TH GRADE ELA AND 8TH GRADE LEVEL MATH
The data below reflects the percentage of students in each subject and grade that scored proficient or advanced on the state's standardized MAP tests during the 2022-2023 school year. MAP stands for Missouri Assessment Program.
The state issues the tests to measure whether students have learned what the state says they should have learned by the end of that school year.
Here's how the students in Rockwood performed, according to the state's data.
ENGLISH LANGUAGE ARTS (ELA)
State data shows the percentage of Rockwood's students that scored proficient or advanced in English Language Arts (ELA) ranged from 54.1% to 65.1%, depending on the grade.
7th grade was lowest.
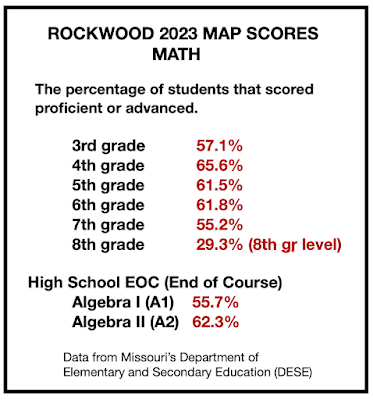
MATHThe state's data shows the percentage of Rockwood's students that scored proficient or advanced in Math ranged from 29.3% to 65.6%, depending on the grade.
8th grade level math was lowest.
Note: The 8th grade statistic only includes scores of students who take 8th grade level math. It does not include more advanced math students.
SCIENCE
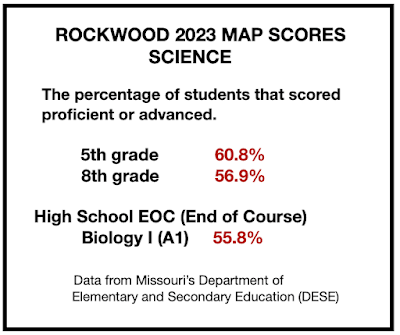
The state's data shows the percentage of Rockwood's students that scored proficient or advanced in Science ranged from 55.8% to 60.8%, depending on the grade.
Biology I at the high school was lowest.
Note: In elementary and middle schools, the state only issues Science tests in 5th grade and 8th grade.
Also note: Rockwood points out on its website that the data above is better than the data for the state.
50 IS THE NEW ZERO
Parents of middle schoolers will be paying closer attention to student performance because, new this year, their students' teachers cannot give anything lower than a 50% on any assignment even if it's not turned in. For more on that, see our
previous report.
EDITED TO UPDATE:
This is the most current data on DESE's website, reflecting MAP scores for all of Rockwood for the 2023-2024 school year.
 |
| This data can be found at this link. Scroll down and choose Rockwood on the map. |
MORE ABOUT THE DATA
The state's department of elementary and secondary education (DESE) keeps MAP score data in various forms, and some of it is on its website. Most easily available is the
performance of the district as a whole.
DESE generally does not break down district data by grade (for its website), but it will for data requests. Every year, the St. Louis County Family Association (SLCFA) requests the data in that form (by grade) and makes it public. That public data is the basis for this report.
To see it, visit the
SLCFA website. In the dropdown menu for school district, choose Rockwood, scroll all the way down to the data tool. Then, choose the subject and grade you want to see.
TEN YEARS WORTH
Note: There are ten years worth of data for each subject and grade on the SLCFA site. DESE puts a disclaimer on its data stating you shouldn't compare data from year to year because of changes to the test and other factors.
DISCLAIMER
But, the data people at DESE tell us you CAN compare the scores from year to year because, regardless of any changes, the data still reflects how students performed each year, with the way the state tested them.


